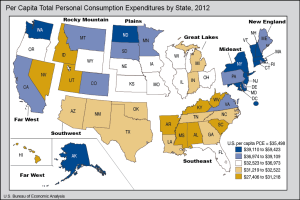
New Yorkers spend more than the national average on health care, housing and utilities but less on gasoline than almost any other state and the District of Columbia, according to federal statistics.
The Bureau of Economic Analysis, which provides economic data including the gross domestic product, released an analysis of personal consumption expenditures. This year”™s statistics, ranging from 1997 to 2012, are considered a prototype analysis and the bureau said it planned to release annual official statistics starting in 2015 if the response and evaluations of the prototype statistics are positive.
The data released last month were the first state-by-state figures on personal consumption expenditures. The bureau is an agency within the U.S. Department of Commerce, which said the figures were beneficial to businesses to make smarter decisions about hiring and investing on the regional level.

“For the first time, we now have rich data on consumer spending decisions in each state, giving us a snapshot of consumer confidence in our economy,” Penny Pritzker, U.S. secretary of commerce, said in a statement. “Unleashing more of our data and making that data more accessible are key Commerce Department priorities, both of which will help strengthen U.S. economic growth, job creation and competitiveness.”
The bureau estimated that New Yorkers in 2012 spent only $919 per capita on gasoline and other energy goods, one of only two states that came in below the $1,000 threshold ”“ with Hawaii spending the least per capita, $882. The national average was $1,328.
National per-capita personal consumption expenditures, or PCE, were $35,498. New York was estimated at $42,043 per capita, above the national and Mideast regional averages but slightly behind neighboring New Jersey ($42,654) and Connecticut, which at $44,549 had the third-highest per-capita PCE. Washington, D.C., had the highest PCE per capita, at $59,423, while Mississippi had the lowest PCE, with estimated per-capita spending of $27,406.
New York spent $2,664 in 2012 for food and beverages for off-premises consumption, slightly below the national average of $2,750 but significantly less per capita compared to the biggest spenders, Alaska ($3,852), Vermont ($3,622) and New Hampshire ($3,616). The lowest in that category was Oklahoma, which spent an estimated $2,179 per capita.
Locally, the estimated per-capita health care cost of $7,303 came in nearly $1,500 above the national average. Washington, D.C., led the pack, at $10,491.
Mark Doms, undersecretary of commerce for economic affairs, said, “BEA”™s new data is a vivid example of how government innovation can benefit businesses and the American public ”“ exactly what we want to showcase as part of the Commerce Department”™s ”˜Open for Business Agenda.”™”
Overall, the statistics show PCE grew in all states in 2012 but at a slower pace than in 2011. North Dakota had the fastest growth rate in the estimated spending, increasing 11.5 percent in 2012 after having grown 11.6 percent in 2011. “Growth in PCE by state reflects both population change and change in per-capita expenditures,” the report said.
The bureau”™s breakdown of GDP by state showed New York had the third-largest portion of the GDP of any state, behind California and Texas. New York”™s GDP in 2012 was $1.2 trillion, while California and Texas had GDPs of $1.9 trillion and $1.3 trillion
Yet, New York saw lackluster growth in its GDP in 2012 ”“ with only a 1.7 percent increase in real GDP over the previous year. The estimated increase in GDP for 2013 is 0.7 percent, which the bureau ranked as the 46th slowest growth rate in the nation based on its estimates.


